Choose What You Want to See in the Reports
When you review the analytics for Previous Tests, you can select what columns you want to see in the report to focus on what’s important to you. We have also simplified the user interface to show you easy to understand icons for the actions. Click on the ‘play’ button to resume the test, the checkmark icon to view the test results, and the chart icon for analytics.

The comprehensive reports have separate sections for subject and chapter levels. You can customize this report to show only the incorrectly answered questions or include the correct and omitted sections. You can also expand subjects to show the chapters and review your performance at the chapter level.
Create Tests From the Reports With a Single Click
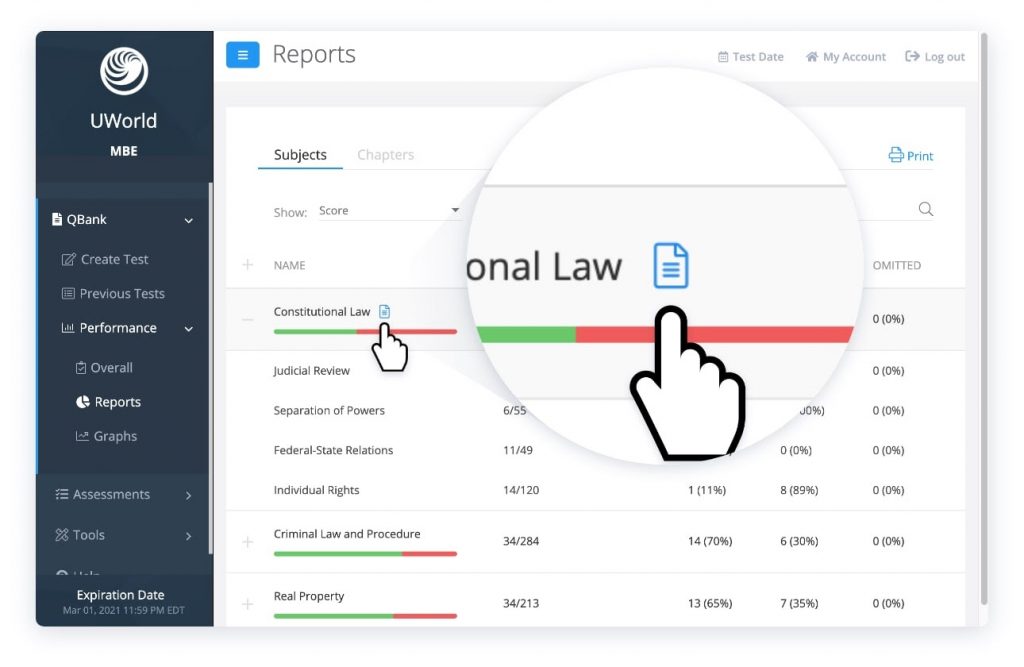
If you hover over the subject, the blue button becomes visible, and you can create a test from these questions.
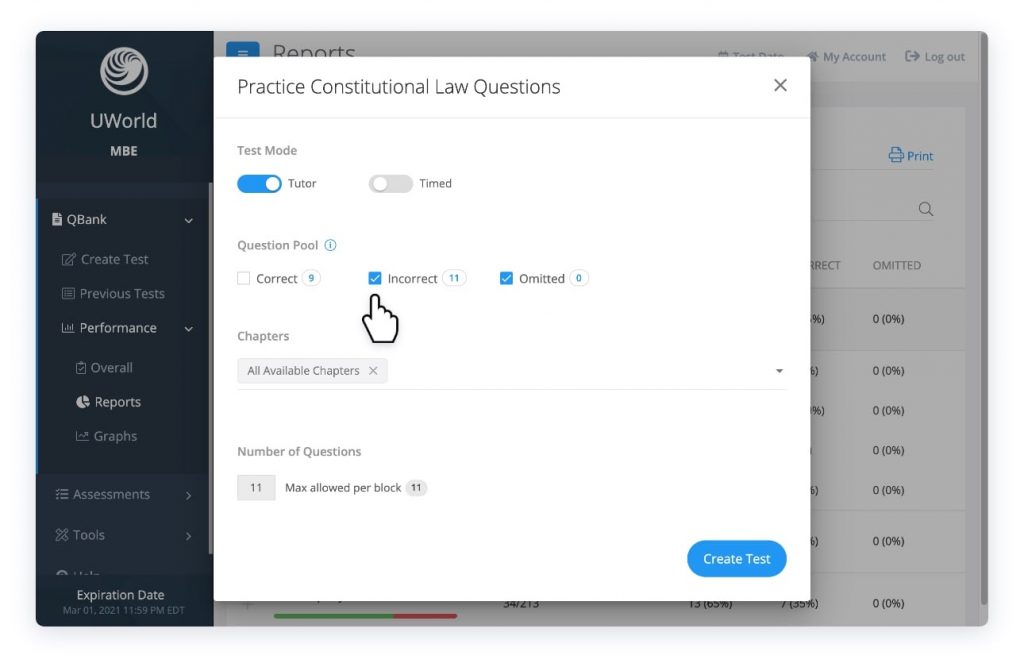
This will help you identify your weak subjects and, within one click, start practicing questions from that specific subject. Note that the Performance section’s Create Test function focuses on previously viewed questions (correct, incorrect, or omitted).
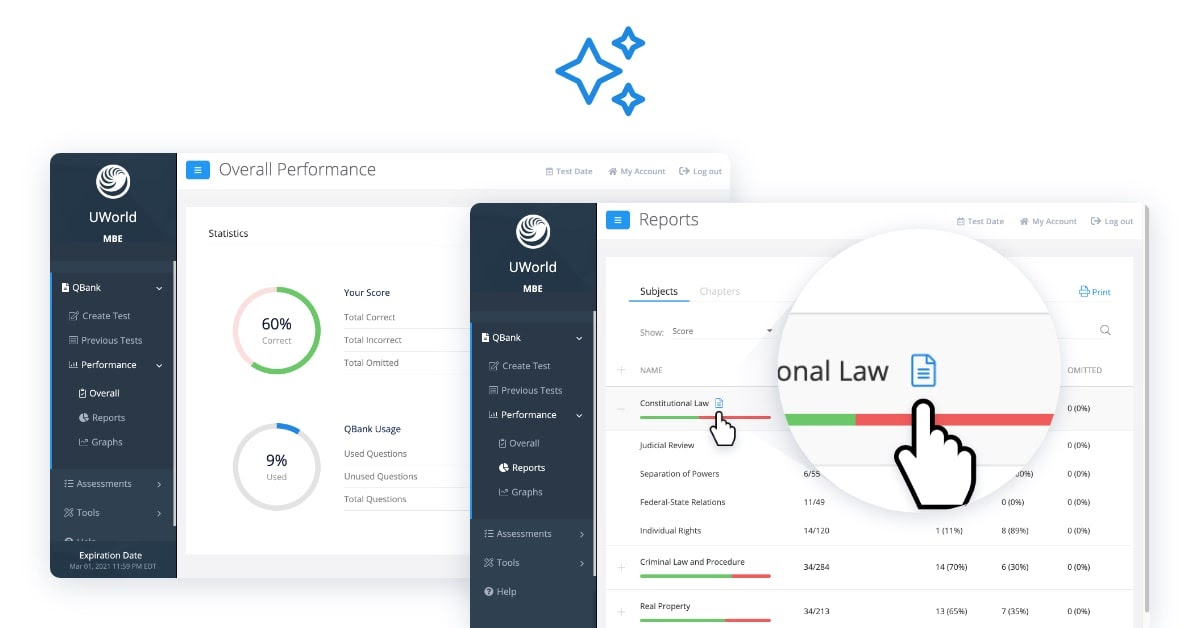
Overall Performance at a Glance

With a glance, you can understand your overall performance, which includes the Test Count data that tells you how many tests you have created, completed, and suspended.
Trending Over Time
The Performance by Date and Performance by Test graphs are now in two separate tabs for a cleaner look. Review these graphs to understand how your performance is trending over a specified period.
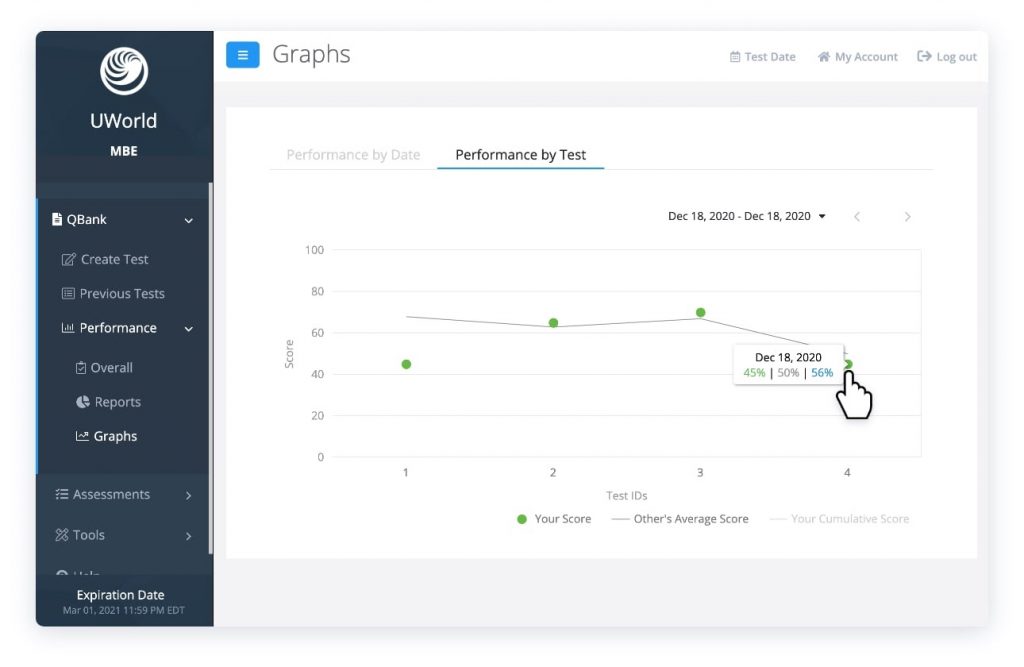
Select “Your Cumulative Score” to show or hide the blue line. Hover over the green dots to review how you performed on a specific test in the past (percentage of correct, incorrect, and omitted questions).